Labeling performance
Powered by the following apps:General statistics for all labeling jobs in team
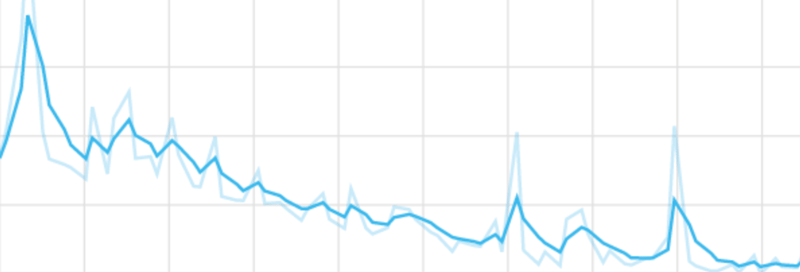
Total number of labeling actions and annotated unique images in a time interval
Supervisely Apps engine made it possible to build essential ecosystem of tools to visualize labeling and model outputs and perform required actions.














With hundreds of ready-to-use applications in our Ecosystem, you get a vital summarization of datasets, models, tasks, action performance in a structured and easy to understand way.
More, good visualization helps you find hidden insights. Discover critical mistakes early and avoid negative long-term consequences. And, because many of our applications are interactive, you can immediately fix problems and get one step closer to the perfect results.
Because Supervisely is built like OS for computer vision, we made possible integration of the best machine learning models and tools on a single platform.
You will find a well-known projects from data science community, as well as our own Apps, providing a complete solution for entire AI development pipeline.
Configure every aspect of training from target classes to online augmentations, monitor metrics and terminal logs in real-time.

Dashboard to configure and monitor training
Understand how your model works on ground truth and new data and find how to correct negative output and increase performance.
Detailed statistics for all classes in images project
Generate synthetic datasets that drastically improve model results, especially when there is not enough ground truth.
Generate synthetic data: flying foregrounds on top of backgrounds
Perform all the necessary actions on your data, from importing and converting to skeletonization of masks and rasterization.

Configure, preview and split images and annotations with sliding window
With so many things you can on Supervisely, it's essential to have a clear and streamlined way to transform existing information on the platform into meaningful reports and charts. Luckily, Supervisely has all the right tools:
General statistics for all labeling jobs in team
Total number of labeling actions and annotated unique images in a time interval

Detailed statistics and distribution of object sizes (width, height, area)

Build labels distribution heatmap for dataset.
Detailed statistics for all classes in images project
Visualizations you have seen can be presented in a form of static reports — a great tool to summarize information and give you a better understanding of what's going on.
But it becomes a much more useful instrument, when you add communication loop into this formula. Now, with the help of interactive widgets, we can build complex tools that significantly boost performance in many tasks across the platform.

Interactive Confusion matrix, mAP, ROC and more
Confusion matrix for selected classes provides a descriptive information about false positive outputs: say, we see that there are 11 images on which birds were detected as dogs.
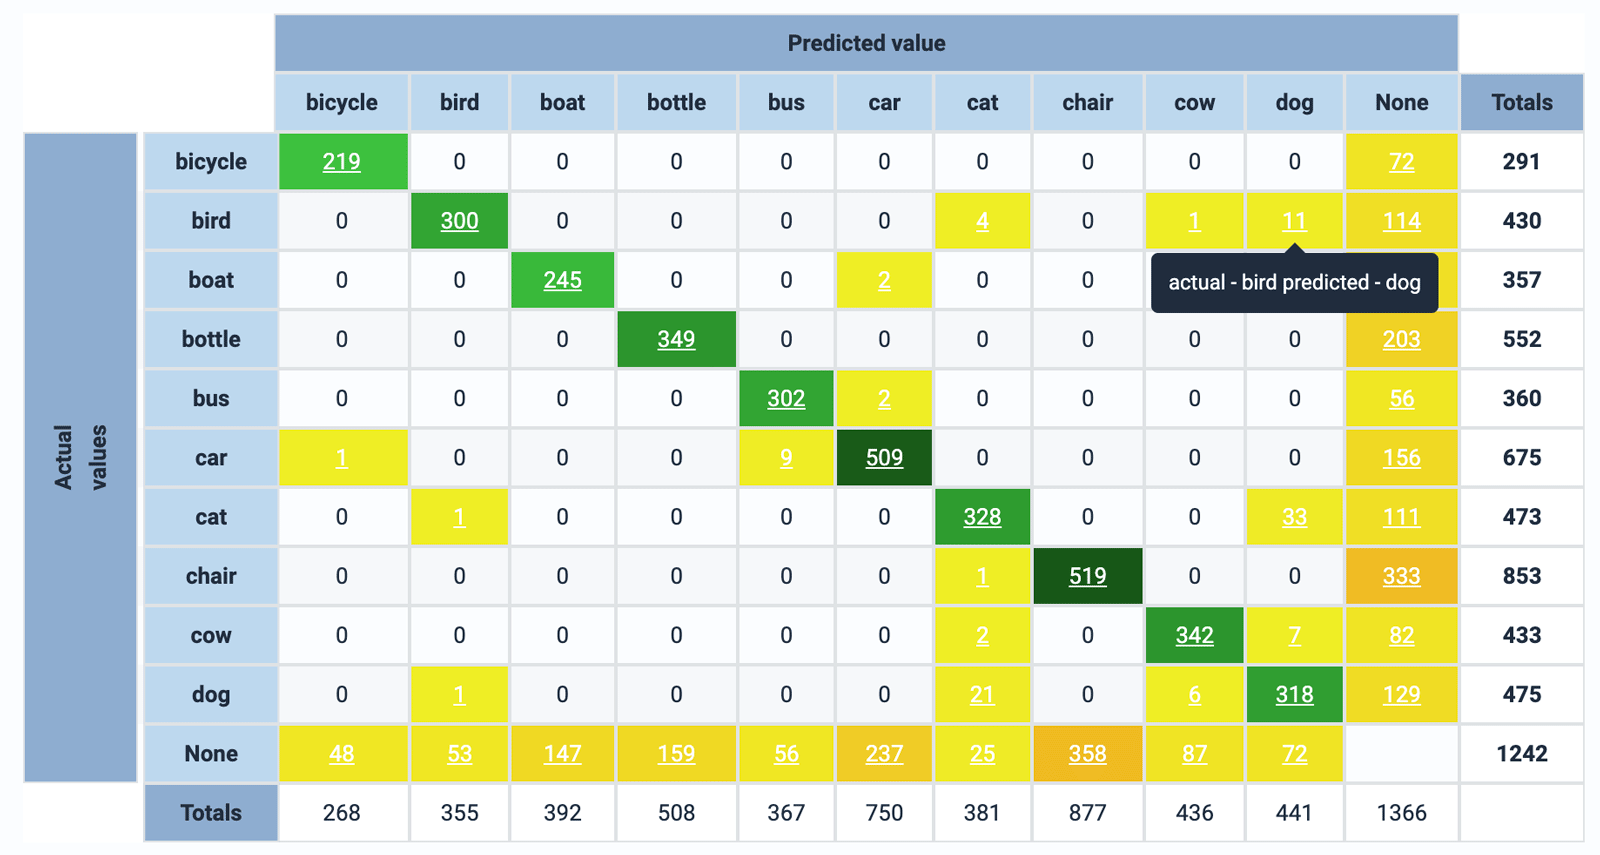
Next, we can click on the cell and see those images:
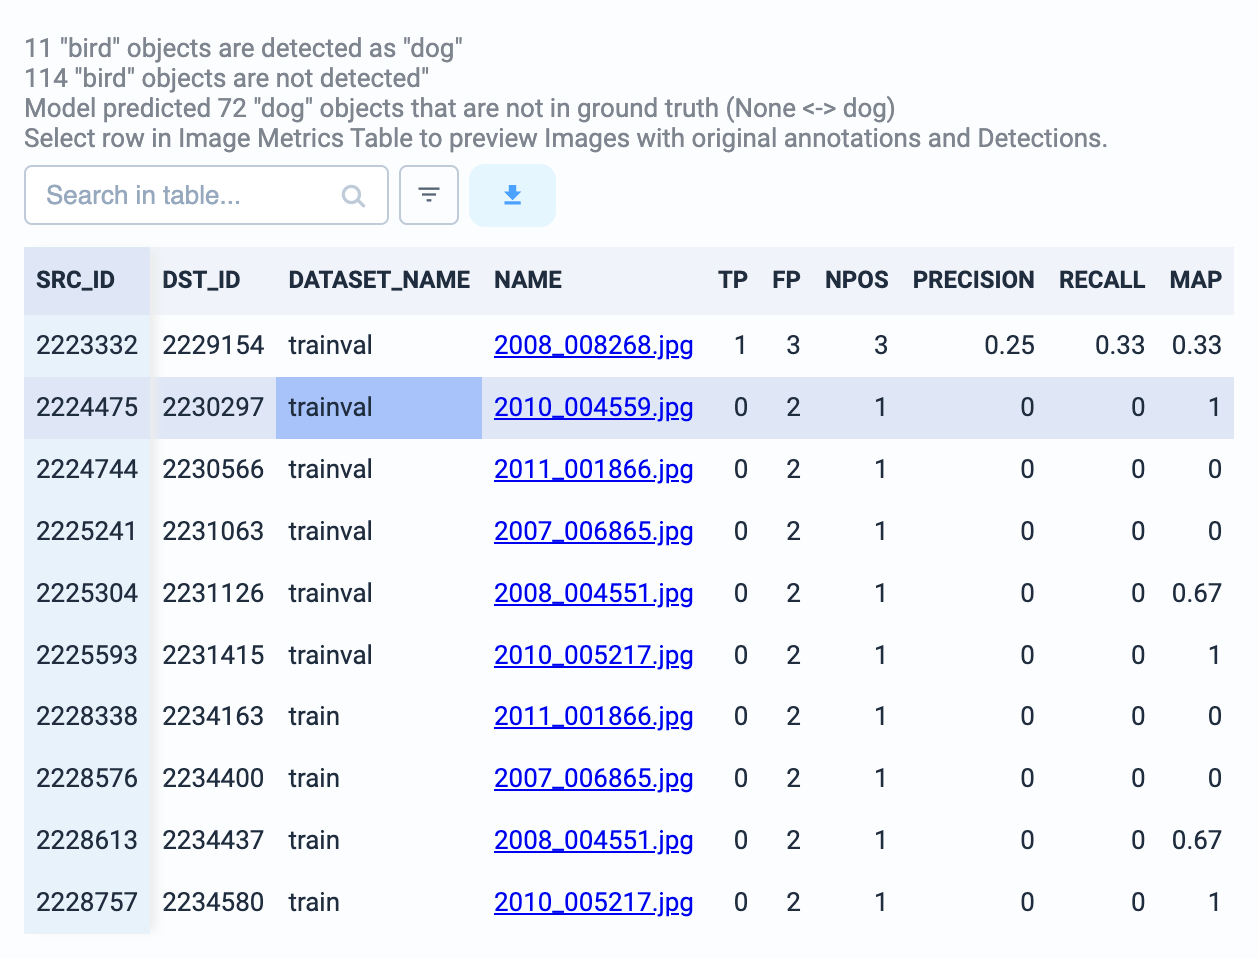
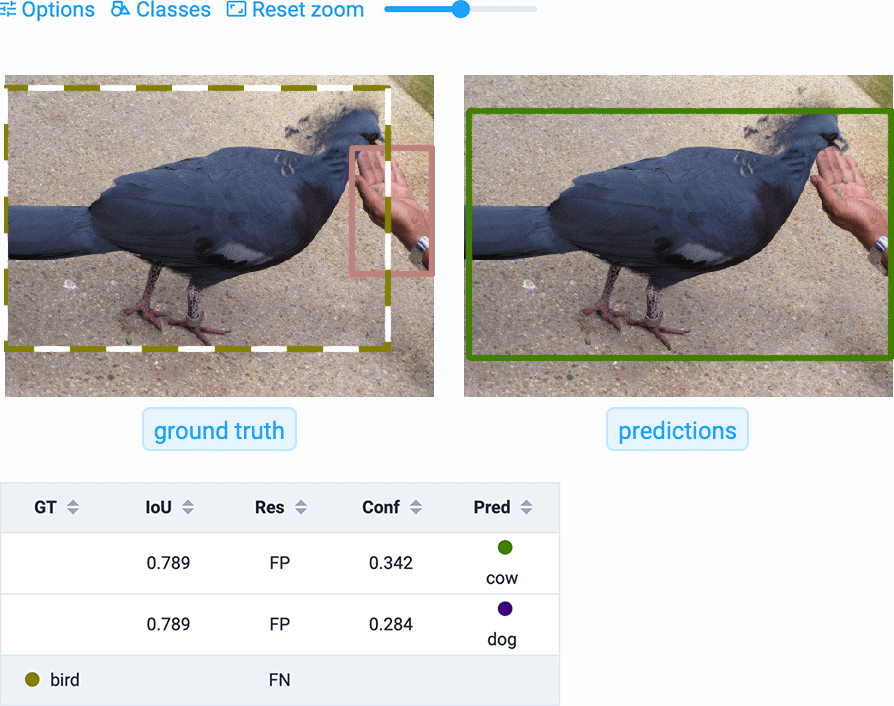
Now, if we select an image, we can clearly see the error. We can immediately open the image in labeling tool and fix the mistake or create a new issue in issue tracker.
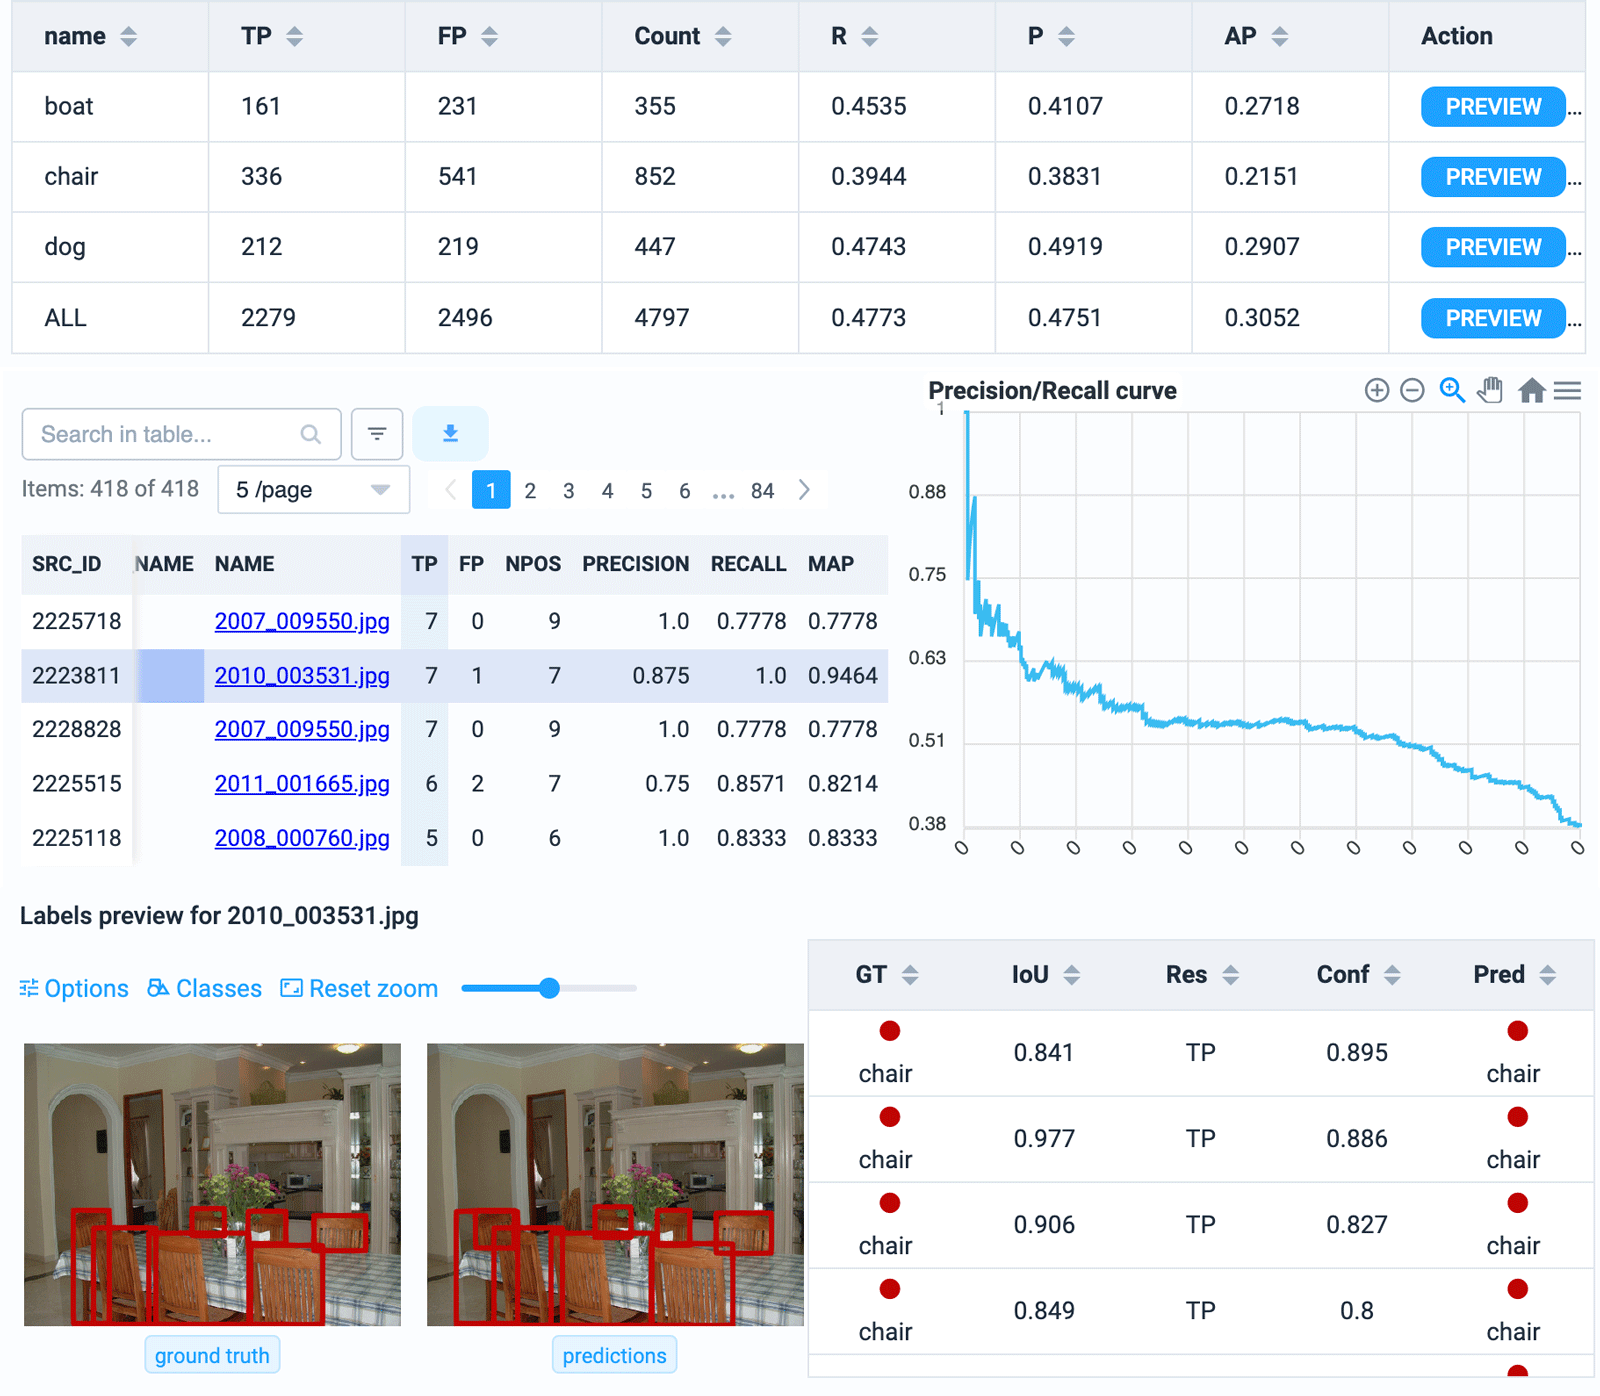
There is more numbers and dimensions you can explore, such as per-classes metrics. Let's select "chair" class and sort Table widget to find images with the largest amount of chairs:
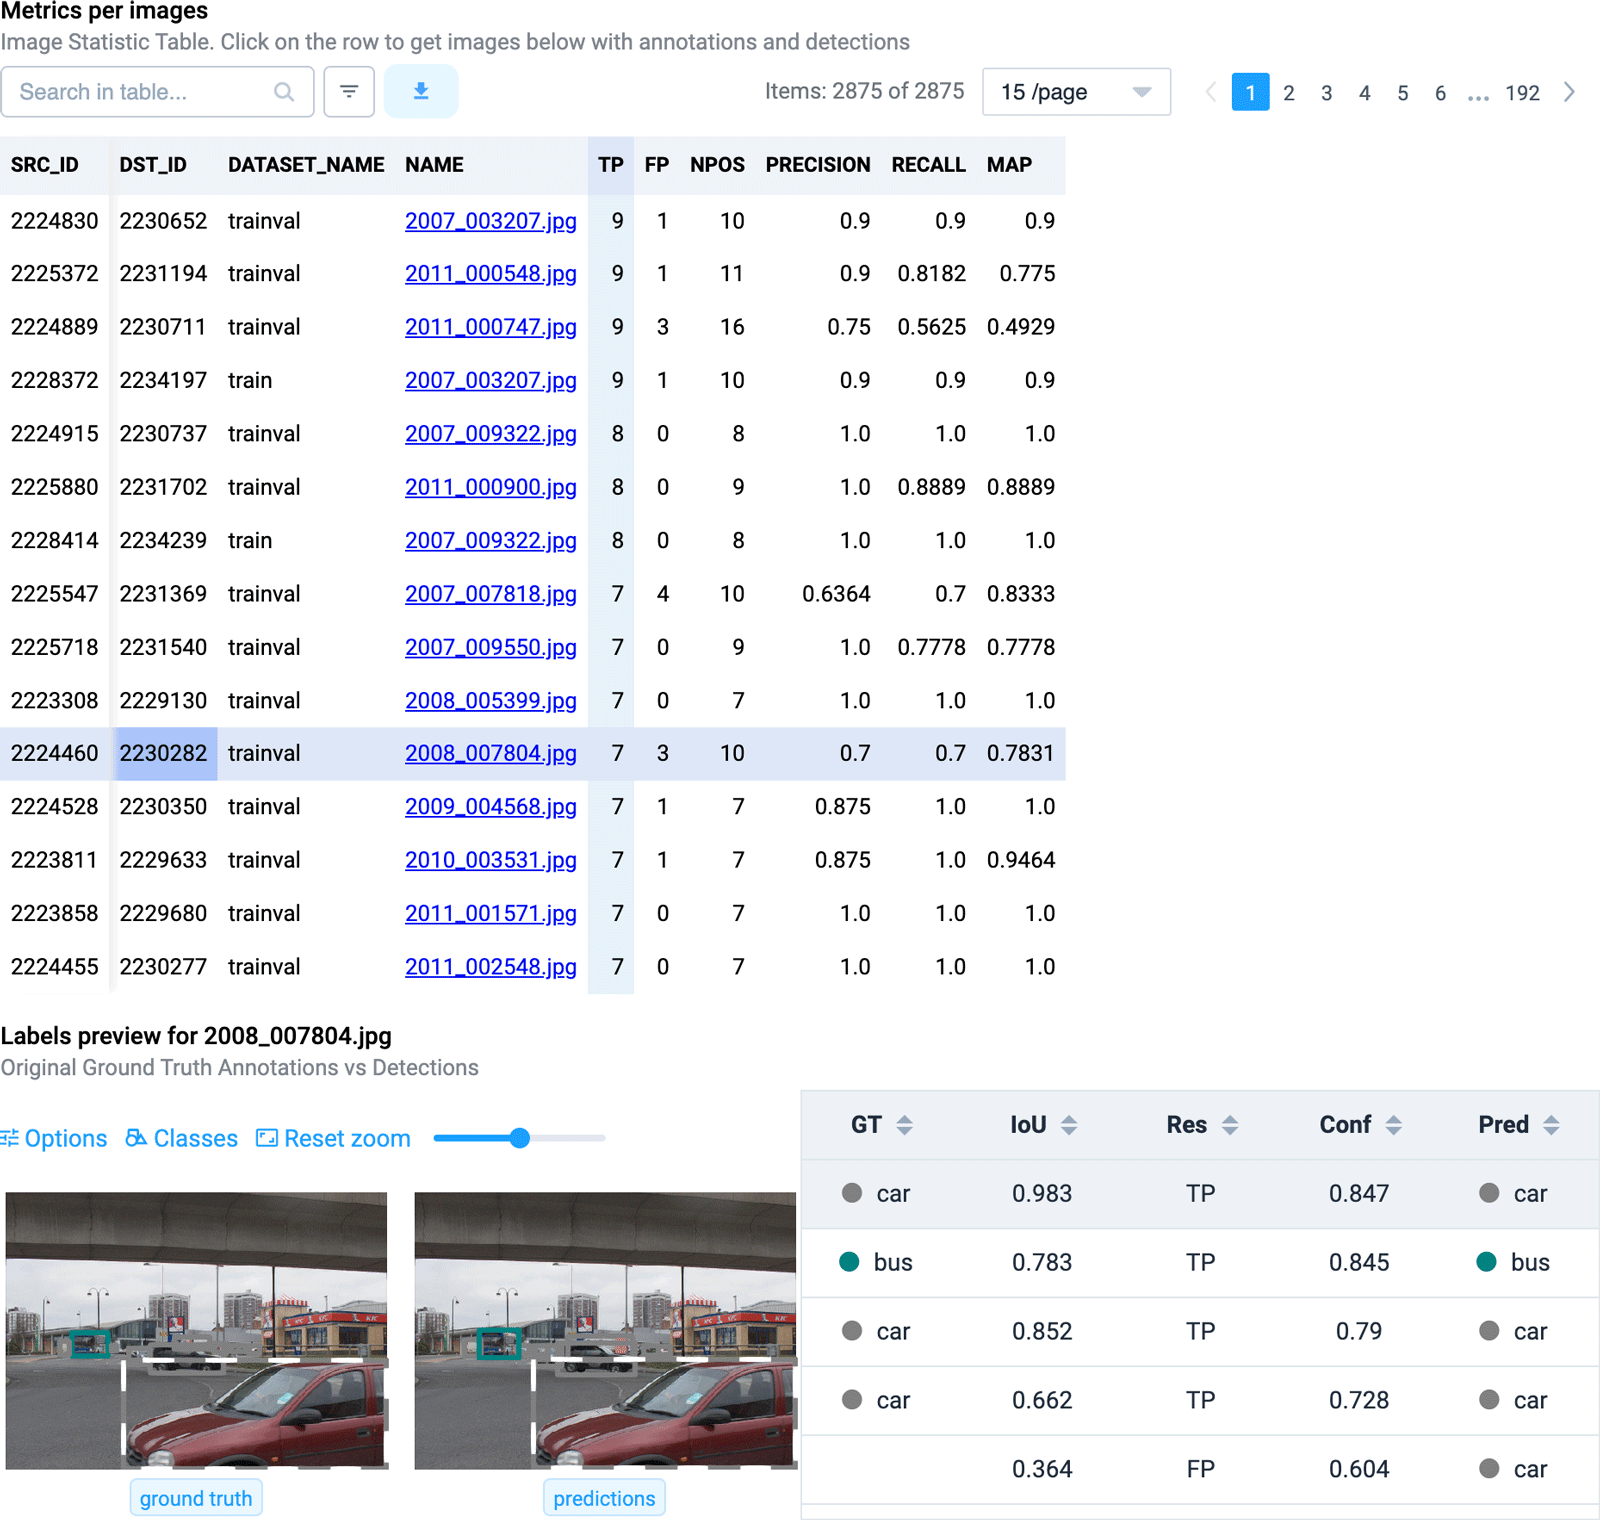
Or see overall picture with per-image metrics:
Constantly growing ecosystem of hundreds of ready-to-use apps that extend and add new functionality.
Learn about EcosystemA fully customizable AI infrastructure, deployed on cloud or your servers with everything you love about Supervisely, plus advanced security, control, and support.
Start 30 days free trial➔


Supervisely provides first-rate experience since 2017, longer than most of computer vision platforms over there.
Join community of thousands computer vision enthusiasts and companies of every size that use Supervisely every day.
Our online version has over a 220 million of images and over a billion of labels created by our great community.


Speak with people who are on the same page with you. An actual data scientist will:
Get accurate training data on scale with expert annotators, ML-assisted tools, dedicated project manager and the leading labeling platform.
Order workforce